Performance and fault isolation of sharing methods
When multiple inference instances share a GPU, the comparison covers inference performance and the effect of a failure on other instances. The baselines run one or two vLLM instances directly. The other configurations are HAMi and NVIDIA MPS-based sharing, measured on throughput, response latency, and fault isolation.
The performance tests run Qwen3-4B on A100 GPUs. The fault tests use a CUDA test program. Fixed-cache performance tests use legacy MPS v2, standard performance tests use GPU Fractioning (which uses MPS v3), and fault tests use MPS v3 directly.
Test objectives
- At the same total concurrency per GPU, compare throughput and latency with one and two inference instances. Then compare two instances with HAMi or MPS enabled.
- Check whether healthy processes on the same GPU and on another GPU continue to compute correctly when a CUDA process fails.
In the performance tables, "native" means running vLLM directly, with HAMi and MPS disabled. The single-instance configuration runs one inference instance per GPU. The two-instance configuration runs two independent CUDA processes per GPU. The native pair provides a baseline with the same instance count as the sharing configurations.
Each configuration handles the same total concurrency per GPU. For example, at total concurrency 8, a single instance handles 8 requests, while each instance in a pair handles 4.
Terms
| Term | Meaning and use in this report |
|---|---|
| CUDA kernel | A function that runs on the GPU. One inference operation calls multiple kernels. |
| Graph / CUDA Graph | Records a set of GPU operations and their dependencies for repeated execution, reducing the CPU overhead of submitting operations individually. In this report, Graph means vLLM's default execution mode, which can use CUDA Graphs. |
| Eager | Submits computation as execution proceeds. These tests enable it with --enforce-eager, which disables CUDA Graphs and vLLM's compilation integration. |
| MPS (Multi-Process Service) | NVIDIA's service for sharing a GPU across CUDA processes through a server. Legacy MPS v2 and MPS v3 refer to different control interface protocols. |
| GPU Fractioning | A GPU sharing component used with KAI Scheduler. These tests use the MPS v3 sharing service in release 0.1.8. |
| KV cache and prefix caching | The KV cache stores attention keys and values that the model has already computed. Prefix caching reuses cached keys and values for prompt prefixes shared across requests. |
| TTFT (Time to First Token) | The time from sending a request to receiving its first token. Lower is better. |
| TPOT (Time per Output Token) | The average time a request takes to generate each subsequent token. Lower is better. |
| p50 and p99 | At p50, 50% of requests finish within the reported time. At p99, 99% do. This report averages the same percentile across instances. |
Test results
- In the fixed-cache Graph test, native single-instance throughput is 628.57, native-pair throughput is 335.51, HAMi 50% pair throughput is 335.87 (+0.11% relative to the native pair), and legacy MPS v2 throughput is 449.36 tokens/s/GPU.
- Across the five concurrency levels in the standard Graph test, throughput differs from the native pair by −0.66% to +2.19% for HAMi 50% and −0.10% to +0.20% for HAMi unlimited. GPU Fractioning is 25.14% to 37.60% higher.
- HAMi 50% throughput is 4.46% to 7.94% below the native pair across the five concurrency levels in the standard Eager test, and 2.22% below it in the fixed-cache Eager test.
- Invalid GPU memory writes, trap instructions, and forced process termination during computation are each tested twice. With native processes or HAMi, healthy processes on the same GPU keep producing correct output. With either the shared or static MPS v3 configuration, healthy processes on the same GPU are affected.
In the fixed-cache test, native single, native pair, and legacy MPS are on set A, and HAMi 50% is on set C. In the standard test, the native pair is on set B, HAMi 50% is on set C, and HAMi unlimited and GPU Fractioning are on set A. A percentage across sets includes both the card difference and the method difference. See Test conditions.
HAMi 2.10 applies the compute limit on kernel launch. After Eager turns Graph off, every kernel launch runs this check, which then decides whether to rate-limit according to the compute quota and whether compute limiting is enabled. Graph replay calls cuGraphLaunch. This version forwards the call directly to the CUDA driver, and the driver executes the recorded compute Graph, so Graph replay bypasses the HAMi rate-limiting path above.
Inference performance
"HAMi 50%" means a 50% compute quota and a 20 GiB memory quota per instance. The compute quotas configured for the two instances on the same GPU add up to 100%.
Fixed-cache comparison: 6 GiB per instance
Total concurrency is 8 per GPU. Each instance has a fixed 6 GiB KV cache, and prefix caching is disabled. Maximum model length is 4096, and maximum sequence count is 32. HAMi has a 50% compute quota per instance, and MPS uses legacy v2. Each configuration is measured three times in one deployment.
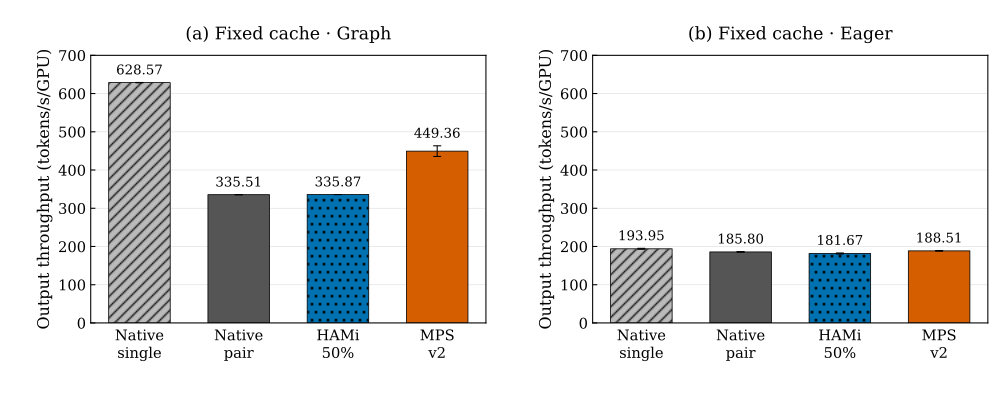
Bars are the mean throughput of three trials. The line on each bar runs from one sample standard deviation below the mean to one above. A longer line means the three trials differ more. Throughput is measured in output tokens/s/GPU. Higher is better.
Throughput is the mean ± sample standard deviation across three trials. Latency is in ms.
| Mode | Configuration | Output tokens/s/GPU | TTFT p50 | TTFT p99 | TPOT p50 | TPOT p99 |
|---|---|---|---|---|---|---|
| Graph | Native single | 628.57 ± 0.30 | 335.46 | 678.19 | 11.42 | 12.02 |
| Graph | Native pair | 335.51 ± 0.02 | 563.53 | 738.61 | 21.71 | 22.40 |
| Graph | HAMi pair (50%) | 335.87 ± 0.06 | 558.37 | 729.45 | 21.71 | 22.39 |
| Graph | Legacy MPS pair | 449.36 ± 13.92 | 413.50 | 538.98 | 16.82 | 17.40 |
| Eager | Native single | 193.95 ± 1.17 | 331.43 | 722.70 | 40.03 | 40.82 |
| Eager | Native pair | 185.80 ± 0.73 | 440.87 | 659.38 | 41.52 | 42.73 |
| Eager | HAMi pair (50%) | 181.67 ± 1.32 | 426.37 | 671.97 | 42.54 | 43.68 |
| Eager | Legacy MPS pair | 188.51 ± 0.73 | 311.23 | 500.70 | 41.37 | 42.55 |
Throughput and latency calculations
The figure and performance tables use the sum of instance throughput: calculate output tokens per second for each instance, sum the rates, and divide by the number of GPUs.
The whole-test calculation divides the total output tokens from all instances by the time from the earliest start to the latest finish, then by the number of GPUs. The two calculations differ when instance measurement intervals overlap only partially. Legacy MPS results are:
| Mode | Sum of instance throughput (tokens/s/GPU) | Whole-test throughput (tokens/s/GPU) |
|---|---|---|
| Graph | 449.36 | 399.28 |
| Eager | 188.51 | 187.29 |
With the whole-test calculation, Graph throughput is 334.50 for the native pair and 334.97 tokens/s/GPU for HAMi 50%. Use the same calculation when comparing configurations.
For latency, average p50 and p99 separately across instances, then average each result across the three trials.
Fixed-cache data · Reference data without compute limiting · HAMi 50% results by trial.
Standard test: automatic cache allocation
The tests run vLLM through Dynamo and use the official run-sweep.sh for load generation. They use automatic KV cache allocation and default prefix caching, with one trial per configuration.
At concurrency 2 and 4 per GPU, the prefix cache read rate is 99.61% for the native single instance and 0% for every two-instance configuration. At concurrency 8, the rates are 49.81% and 0%, respectively. Rates for all five concurrency levels are in the standard-test CSV. The single-instance and two-instance gap includes this difference in cache reuse. The fixed-cache test has prefix caching off.
Total concurrency per GPU is 2, 4, 8, 16, and 32. All configurations except native single run two instances per GPU. Both HAMi configurations have a 20 GiB memory quota per instance. Throughput is measured in output tokens/s/GPU. Bold marks the highest value at each concurrency level. Parentheses show the difference relative to the native pair.
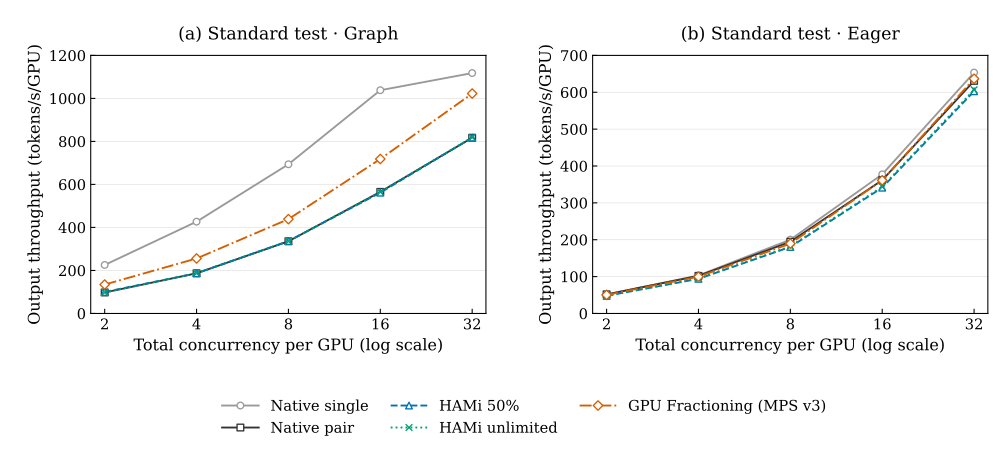
Each line is one configuration, and each point is one trial measured for that configuration at one concurrency level, including GPU Fractioning and HAMi unlimited. Higher is better.
Graph (default)
| Concurrency/GPU | Native single | Native pair | HAMi 50% | HAMi unlimited | GPU Fractioning |
|---|---|---|---|---|---|
| 2 | 225.50 | 97.66 | 99.80 (+2.19%) | 97.61 (−0.05%) | 134.37 (+37.60%) |
| 4 | 426.82 | 186.77 | 186.92 (+0.08%) | 186.76 (0.00%) | 255.64 (+36.88%) |
| 8 | 693.67 | 335.67 | 336.52 (+0.25%) | 335.62 (−0.02%) | 438.59 (+30.66%) |
| 16 | 1038.10 | 565.45 | 561.73 (−0.66%) | 564.90 (−0.10%) | 718.28 (+27.03%) |
| 32 | 1117.88 | 817.12 | 817.89 (+0.10%) | 818.71 (+0.20%) | 1022.54 (+25.14%) |
Eager
| Concurrency/GPU | Native single | Native pair | HAMi 50% | HAMi unlimited | GPU Fractioning |
|---|---|---|---|---|---|
| 2 | 51.26 | 51.84 | 47.76 (−7.88%) | 48.11 (−7.20%) | 50.34 (−2.91%) |
| 4 | 103.10 | 101.99 | 93.89 (−7.94%) | 94.42 (−7.42%) | 99.66 (−2.29%) |
| 8 | 200.28 | 194.53 | 180.49 (−7.21%) | 182.01 (−6.44%) | 189.54 (−2.57%) |
| 16 | 377.41 | 361.61 | 341.28 (−5.62%) | 343.67 (−4.96%) | 361.11 (−0.14%) |
| 32 | 653.43 | 630.84 | 602.68 (−4.46%) | 606.86 (−3.80%) | 636.66 (+0.92%) |
Throughput differences across the five concurrency levels:
- HAMi 50% (Graph): −0.66% to +2.19% relative to the native pair.
- GPU Fractioning: 25.14% to 37.60% above the native pair in Graph, and −2.91% to +0.92% in Eager.
- HAMi (Eager): 4.46% to 7.94% below the native pair with the 50% quota, and 3.80% to 7.42% below it without compute limiting.
Response latency: concurrency 8 per GPU
The table shows the mean of the per-instance p99 values, in ms.
| Configuration | Graph first token | Graph subsequent tokens | Eager first token | Eager subsequent tokens |
|---|---|---|---|---|
| Native single | 665.76 | 11.95 | 730.71 | 40.39 |
| Native pair | 730.35 | 22.44 | 669.55 | 40.83 |
| HAMi 50% | 714.99 | 22.41 | 588.04 | 44.52 |
| HAMi unlimited | 739.09 | 22.43 | 599.89 | 43.90 |
| GPU Fractioning | 427.74 | 17.48 | 595.79 | 42.67 |
Relative to the native pair, HAMi 50% has lower first-token p99 latency and higher subsequent-token p99 latency in Eager mode.
Fault isolation results
A faulting process and a healthy process run on the same GPU, with a healthy control process on another GPU. Healthy processes replay a CUDA Graph and check their output. Each case runs twice, with observation for 3 seconds before the fault and at least 6 seconds afterward.
The fault tests use HAMi without compute limiting, with a 20 GiB memory quota per instance. MPS v3 is tested in shared and static-partition configurations. The shared configuration enables memacct and context-share.
2/2 means the healthy process on the same GPU produced correct results in both trials. 0/2 means it was affected in both trials.
| Injected event | Native processes | HAMi processes | MPS v3 shared | MPS v3 tested static configuration |
|---|---|---|---|---|
| Excess memory allocation | 2/2 | 2/2 | 2/2 | 2/2 |
| Invalid GPU memory write | 2/2 | 2/2 | 0/2 | 0/2 |
| GPU trap instruction | 2/2 | 2/2 | 0/2 | 0/2 |
| SIGKILL during computation | 2/2 | 2/2 | 0/2 | 0/2 |
| Safe MPS client termination | N/A | N/A | 2/2 | 2/2 |
All 36 control trials on the other GPU pass. The excess-memory case requests twice the visible capacity, and all allocation requests are rejected. Fault counts, error codes, and maximum sample gaps (CSV).
The two clients in the static configuration each report 54 streaming multiprocessors (SMs), with different partition IDs. See MPS fault handling and static partitioning for the mechanisms.
Test conditions
Hardware: 2× A100-SXM4-40GB. Software: Ubuntu 24.04.5, NVIDIA driver 615.71.10, Dynamo 1.6.1, vLLM 0.31.0, and AIPerf 0.13.0. The model is Qwen3-4B in BF16. Each instance uses one GPU. Input length is 2,048 tokens, and output length is 256 tokens.
Sets A, B, and C are each two A100-SXM4-40GB GPUs, and each letter is a different physical pair. The same letter is the same pair. Cards of the same model differ in performance, so a percentage taken across sets includes both that card difference and the sharing-method difference. The set and collection date for each test are below.
| Test | Configuration | GPU set | Collection date (UTC) |
|---|---|---|---|
| Fixed cache | Native single | A | 2026-11-03 |
| Fixed cache | Native pair | A | 2026-11-03 |
| Fixed cache | Legacy MPS | A | 2026-11-03 |
| Fixed cache | HAMi unlimited | A | 2026-11-03 |
| Fixed cache | HAMi 50% | C | 2026-11-05 |
| Standard | Native single | A | 2026-11-02 |
| Standard | Native pair | B | 2026-11-04 |
| Standard | HAMi 50% | C | 2026-11-05 |
| Standard | HAMi unlimited | A | 2026-11-02 |
| Standard | GPU Fractioning | A | 2026-11-02 |
| Fault | Native, HAMi unlimited, MPS v3 shared, MPS v3 static | B | 2026-11-04 |
The standard-test deployment configurations are below. Legacy MPS v2 settings for the fixed-cache tests and MPS v3 settings for the fault tests are in their respective sections.
| Deployment | Instances/GPU | Memory configuration | Execution configuration |
|---|---|---|---|
| Native single | 1 | Full-device memory visibility | Independent CUDA process |
| Native pair | 2 | Engine memory utilization 0.45 per instance | Independent CUDA processes without HAMi or MPS |
| HAMi 2.10.0 pair | 2 | 20 GiB quota per instance | 50% compute quota per instance |
| HAMi 2.10.0 pair (unlimited) | 2 | 20 GiB quota per instance | Compute limiting disabled |
| KAI 0.18.6 + GPU Fractioning 0.1.8 pair | 2 | 20 GiB quota per instance | MPS v3 sm-sharing without static SM partitioning |
These tests use the shared MPS service from the GPU Fractioning v0.1.8 release. The NVIDIA report uses the KAI-Scheduler and GPU Fractioning revisions maintained by nv-kmcgill53. Both branches are named kmcgill/sm-sharing-main. Each container gets its own MPS namespace, with compute and memory quotas.
Reproduction scripts
Run the tests · Source code · All results
Raw data: Standard tests CSV · No compute limit CSV.
Conclusion
Whether a sharing method is worth recommending depends on the Pareto frontier of NVIDIA containerized GPU virtualization. That frontier has not been measured, and this report DOES NOT recommend any method.
